Sampling plots
If your samples are
collected at constant sampling plots,
you may use the module DiversitySamplingPots to describe
said
SamplingPlots. For a better differentiation between
events and the
SamplingPlots there is a brown text in
the hierarchy as well as a different icon  .
A SamplingPlot can contain other
SamplingPlots
and CollectionEvents. Information about the geographic
locality and properties of the collection
site can be stored in the SamplingPlot, while the collecting date
must be stored in the CollectionEvent. To show or hide the
SamplingPlots you have two
options. In the panel on the left
of the tree the
button will show the superior
SamplingPlots of the current
CollectionEvent as shown below.
.
A SamplingPlot can contain other
SamplingPlots
and CollectionEvents. Information about the geographic
locality and properties of the collection
site can be stored in the SamplingPlot, while the collecting date
must be stored in the CollectionEvent. To show or hide the
SamplingPlots you have two
options. In the panel on the left
of the tree the
button will show the superior
SamplingPlots of the current
CollectionEvent as shown below.
The
 button will show the entire hierarchy of the SamplingPlots
as shown below.
button will show the entire hierarchy of the SamplingPlots
as shown below.
If you select a SamplingPlot in
the hierarchy,
two buttons will appear in the bar to the left of the tree. With
the
 button you can retrieve a taxon
list for the SamplingPlot.
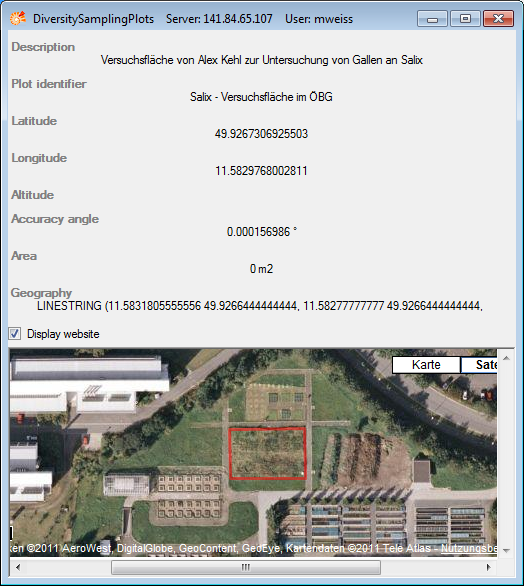
With the button you
can retrieve a summary
of the information on a SamplingPlot (see image below).
button you can retrieve a taxon
list for the SamplingPlot.
With the button you
can retrieve a summary
of the information on a SamplingPlot (see image below).
To edit the data of a SamplingPlot
please use the module DiversitySamplingPlots.
The link to the module
DiversitySamplingPlots is
stored in the table CollectionEventLocalisation.