Maps of samples in the
database
If there are WGS84
coordinates available for your
collection site, an event series or
single organisms, you can use
GoogleMaps to
display these locations.
To use this service you
need access to the
internet. Select the
 Map for display in the header area to show the maps. Here you can display maps of
 CollectionEventSeries,
  CollectionEvent,
 Organism as well as
 Distribution maps. To
display the maps
you can either use the
Distribution maps. To
display the maps
you can either use the  browser, the
  web viewer, the
  GIS viewer or the
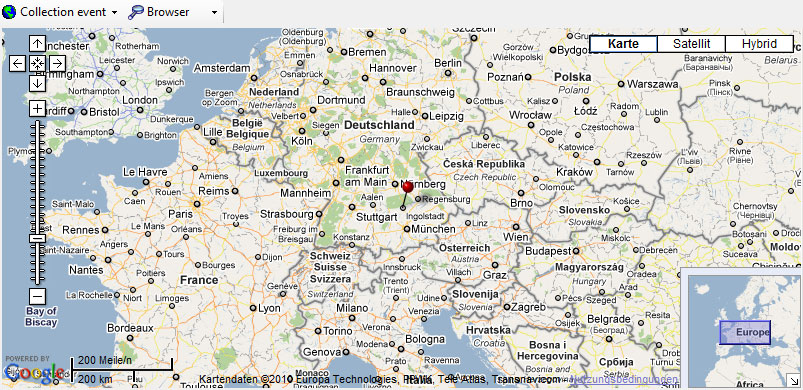
  GIS editor. By default the map will
show the
location of the CollectionEvent using the browser as shown
below.
GIS editor. By default the map will
show the
location of the CollectionEvent using the browser as shown
below.
The two options
browser and
web viewer in principle provide the same function, but
rely on different controls. Due to incompatiblities between
controls and the google web API you may have to test both to
display a map.
For the CollectionEventSeries,
the CollectionEvent or the
Organism you can use any
geographical object like points, lines, areas, etc. to describe the
location.
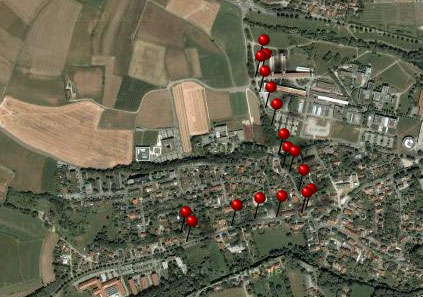
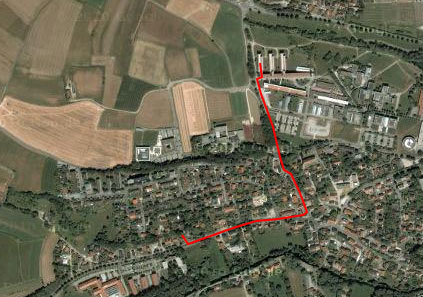
The browser will always display these objects as points (see left
image below)
whereas with the GIS editor you can see
and edit the real objects (see right image
below).
The data of the
geographical objects is stored in the
table CollectionEventSeries
for the collection event series, the
table CollectionEventLocalisation
for the collection event and the
table IdentificationUnitGeoAnalysis
for the organisms.