 button and they will be hidden in the tree. The button will
change to a grey version
button and they will be hidden in the tree. The button will
change to a grey version
 and the background will turn yellow
to show that there is hidden data of the
collectors.
and the background will turn yellow
to show that there is hidden data of the
collectors.
The upper tree in the
window provides an overview
for all the data linked with the specimen. With the buttons in
the left panel you
may hide or show certain nodes in the tree. If for example you
do not wish to
see the collectors, simply click on the
button and they will be hidden in the tree. The button will
change to a grey version
and the background will turn yellow
to show that there is hidden data of the
collectors.
If the CollectionEvent is part of a CollectionEventSeries, a drop-down button will appear where you may select between 3 states:
 = show the parent EventSeries
 = show the entire hierarchy of the EventSeries
 = hide the EventSeries
If the CollectionEvent is linked to a SamplingPlot, a drop-down button will appear where you may select between 3 states:
 = show the parent SamplingPlots
 = show the entire hierarchy of the SamplingPlots
 = hide the SamplingPlots
If
both options are available, you may choose between the
CollectionEventSeries
or the SamplingPlot hierarchy. If the entire hierarchy for the
EventSeries
or the SamplingPlots is displayed, the items not included in the
current
data set will be displayed with gray icons, e.g.
 . To
change to one of these use the
. To
change to one of these use the
 button. For the
Events, the EventSeries, the Plots and the Specimen a
button. For the
Events, the EventSeries, the Plots and the Specimen a
 button will appear which will give you access to a taxon list of
the selected
item.
button will appear which will give you access to a taxon list of
the selected
item.
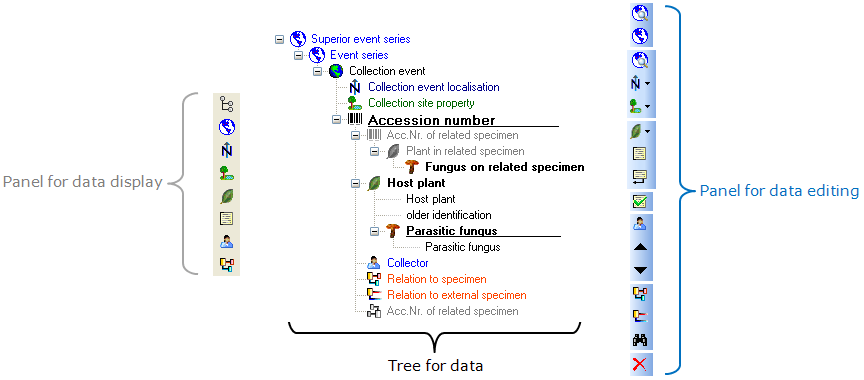
The panel on the right side
of the tree is used for editing
the data, for example the
button will insert a new collector. For further details see the
special sections. For data with Read only access these panels are disabled except the button for
adding annotations
 .
.