Since GIS Editor version 2.2.3.0 the Sample Detection offers a new convenient tool to digitize sample markers e. g. of a scanned and georeferenced analog paper sheet.
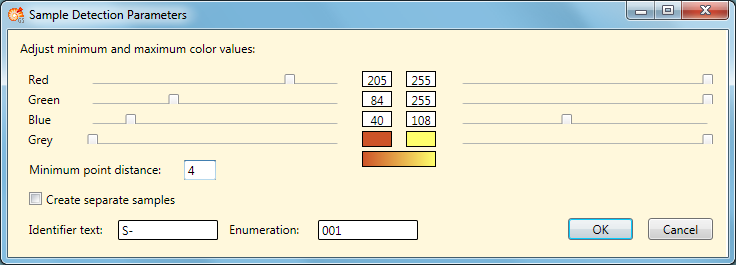
The tool will try to detect "points" on an image according to the detection parameters which can be adjusted
in the Sample Detection Parameters window, which will open when clicking the
 button.
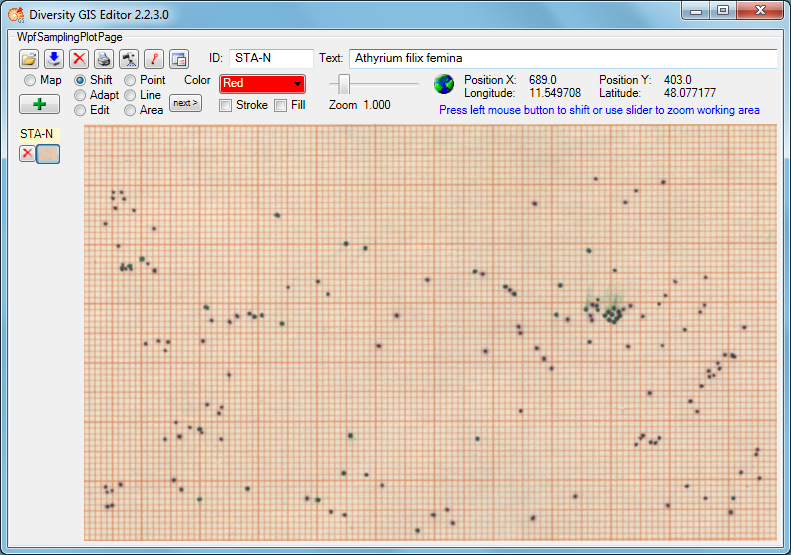
The decision what belongs to a sample and what is just background on the loaded image is made by defining a color range of the object to be found. Looking at the example picture above, we can see that the collector has marked samples using a "black" pen on a reddish scale paper. The points appear as dark grey scatterplots. To detect these points we must define the color range of interest from "mid grey" to "black".
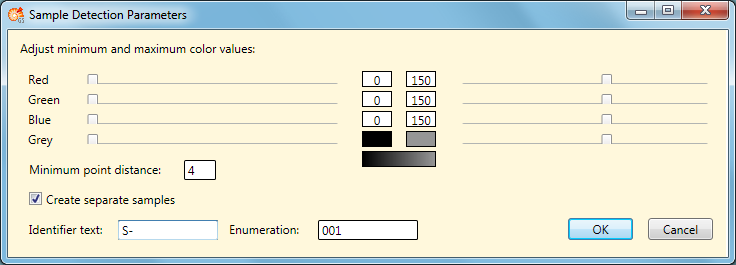
The grey range can be easily set by moving the "Grey" sliders for minimum and maximum values. The sliders for the 3 color channels will move simultaneously, adjusting the channel values in parallel. In the example above we found a range from 0 (black) to 150 (mid grey) which covers the colors of the samples and excludes the background colors. It is visualized in the color boxes for min and max values and as a linear gradient color brush.
If we'd look with a magnifying glass on a single point, we would discover that in fact it is an array of pixels (picture elements) in various shades of grey. To reduce this "cloud" to a single point coordinate the program uses several algorithms. The result can be improved by setting the parameter for the minimum point distance in pixels to an appropriate value (e. g. 4).
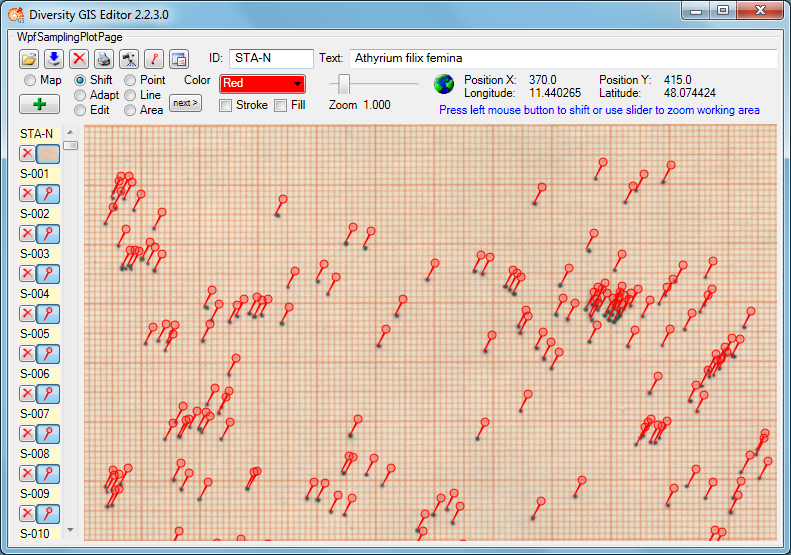
The resulting sample points would be displayed as a point collection to be (potentially) edited and added as one sample to the GIS Editor sample list. In contrast, clicking the check box beneath will split up the found sample points into single samples and add them immediately to the sample list including an enumeration. The sample names will then be composed by Identifier and Enumeration (start value, will be incremented) as defined in the text boxes under it. Pressing the OK button will start the detection and deliver the detected points as object markers.
Not only grey points may be detected, but markers of any color tone. The ranges for the red, green and blue color channels can be adjusted individually by moving the sliders for min and max values. The gradient color brush gives you a hint about the resulting color range, but it needs much experience to define a color range properly to get the expected results.